If you’ve been working in digital marketing or SEO for any amount of time, you know that reporting traffic data is not always straightforward. Often, the numbers aren’t 100% accurate, and this can lead to tricky conversations with clients or bosses. They see one set of numbers in their CRM, and you’re showing them something completely different. What’s the solution to this? Directional reporting.
Instead of focusing on exact numbers, directional reporting shifts the focus to trends and overall movement—whether traffic is increasing or decreasing, whether a specific marketing effort is working or not. In this guide, we’ll dive into how you can use directional reporting in GA4 to improve your communication and avoid those difficult conversations.
What is Directional Reporting?
Directional reporting is the practice of focusing on the direction of the data—whether it’s increasing or decreasing—rather than getting hung up on the precise numbers. It’s about identifying the key insights in your data and presenting trends that tell a story about your traffic and performance.
By emphasizing directionality, you shift the conversation from “Are these numbers accurate?” to “What is this data telling us?” This makes it easier to discuss strategy and future actions, rather than getting stuck in debates over data accuracy.
The Importance of Directionality in GA4

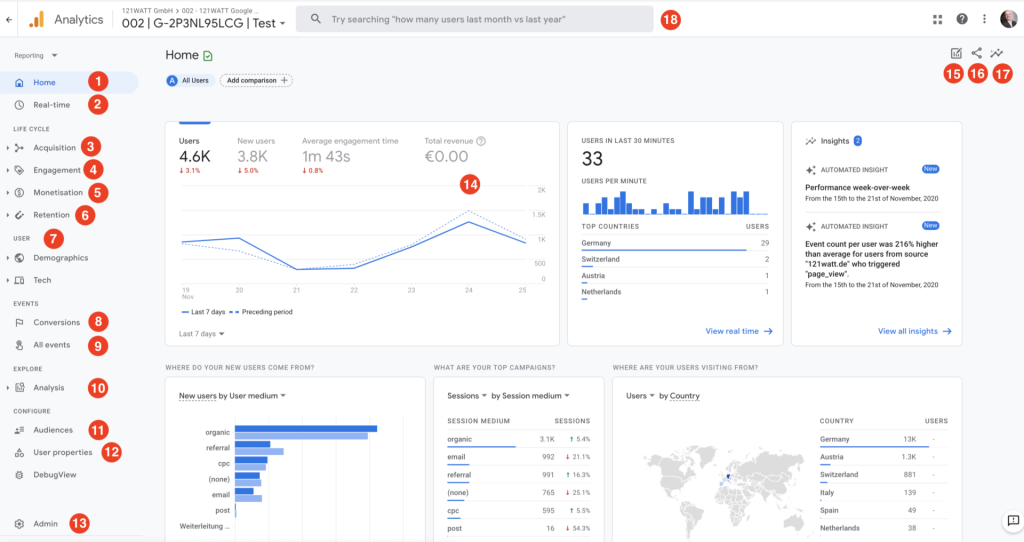
GA4, Google’s latest analytics platform, is a powerful tool, but it’s not without its flaws. One of the main issues marketers face is that GA4’s data isn’t always 100% accurate. Ad blockers, cookie restrictions, and other third-party tracking limitations can cause discrepancies in the numbers.
Directional reporting complements GA4 by focusing on the overall trend of the data, rather than relying on specific numbers. It acknowledges that while the data might not be perfect, it’s still useful for drawing larger conclusions about performance.
Common Issues with Traditional Reporting
When you present raw numbers—like the number of form submissions, traffic sessions, or conversions—you often end up in a difficult conversation with your client or boss. They might see different numbers in their CRM or other tracking tools, and they’ll ask, “Why are your numbers different from mine?” This can lead to confusion, mistrust, and frustration.
Shifting the Focus: Why Percentages Matter More Than Numbers
To solve this issue, shift your focus from raw numbers to percentages. In GA4, events like form submissions or video views can be converted into percentages of the total traffic. This gives you a more meaningful way to compare performance across different pages or channels.
For example, instead of saying, “We had 38 conversions on Page A,” you could say, “Page A accounted for 20% of total sessions but generated 46% of conversions.” This tells a much clearer story about how effective the page is.
Creating Actionable Reports in GA4
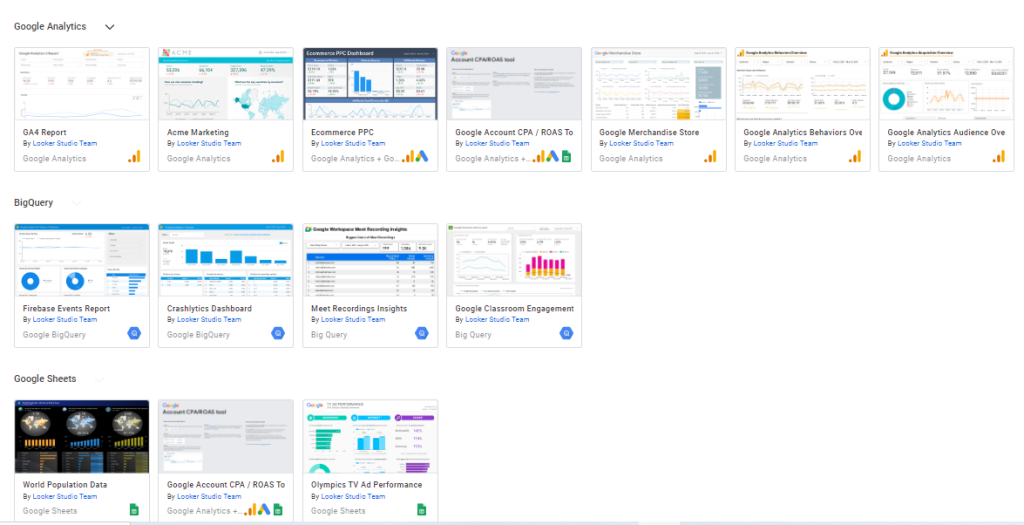
Here’s a quick step-by-step guide to creating more actionable reports in GA4 using Looker Studio:
- Open Looker Studio and connect your GA4 data.
- When setting up your reports, focus on key events like sessions, conversions, and bounce rates.
- Instead of reporting the exact numbers, convert these into percentages of the total.
Using Looker Studio for Directional Reporting

Screenshot from Looker Studio, September 2024
Looker Studio allows you to adjust metrics easily. You can convert raw numbers into percentages, which helps in conveying the message clearly. For example, if a page had 400 sessions but contributed to 60% of the total conversions, that’s much more insightful than just stating the numbers.
Reporting on Landing Page Performance
When analyzing landing pages, it’s important to look at the percentage of sessions versus the percentage of conversions. You might find that a page with fewer sessions is performing much better in terms of conversions. This insight allows you to replicate the success of one page across others.
Video Performance Analysis: Driving Sales through Media
When a client or boss is excited about a new video they’ve created, it’s essential to track its effectiveness. In GA4, create two audiences: one for users who engaged with the video and one for those who didn’t. Then, compare the conversion rates between the two groups.
By converting these metrics into percentages, you can clearly see whether the video is driving more conversions. This makes it easier to report whether the video is a valuable asset or not.
Handling Client Expectations with Directional Data
Explaining the concept of directionality can help clients or bosses understand why they shouldn’t be too focused on exact numbers. You can explain that data tracking isn’t always perfect due to technical limitations, but that the general trend is what really matters.
Introducing Rounding in Reports
Another useful trick is to round your numbers. Instead of reporting exact figures like “241,385 sessions,” round it to something more digestible, like “241,400 sessions.” This simplifies the data and reinforces the idea that pinpoint accuracy isn’t necessary for effective reporting.
The Role of Visuals in Reporting
Charts and graphs can make your reports more engaging. A well-designed line graph showing an upward trend in traffic will have a greater impact than raw numbers. Visual aids help reinforce the key takeaways from the data and keep the focus on the direction, not the details.
Actionable Takeaways for Improving Marketing Strategy
By focusing on directional reporting, you’re not just presenting data—you’re telling a story about performance. These insights are far more actionable and can lead to meaningful improvements in marketing strategy. For instance, if one landing page is converting at a much higher rate than others, you can take steps to replicate its success across other pages.
Conclusion
Directional reporting allows you to shift the conversation from the accuracy of the numbers to the story they’re telling. It’s a more effective way to present your data, especially when using a tool like GA4, which isn’t always 100% accurate due to tracking limitations. By focusing on percentages, trends, and visual aids, you’ll be able to provide more actionable insights that can help improve marketing performance.
FAQs
1.What is directional reporting?
Directional reporting focuses on the general trend or direction of your data (up or down) rather than on precise numbers, making it easier to draw actionable insights.
2. Why is GA4 not always accurate?
GA4 faces challenges like ad blockers and cookie restrictions, which can lead to discrepancies in data tracking, making it less precise.
3. How can I make my GA4 reports more effective?
Use Looker Studio to convert raw numbers into percentages, focus on trends, and visualize the data through graphs to make it more digestible.
4. Why should I round numbers in reports?
Rounding simplifies data presentation and reduces the focus on exact precision, helping clients focus on the overall trend rather than specific numbers.
5. How can I explain directional reporting to clients?
You can explain that due to technical limitations in tracking, precise numbers may not always be accurate. The focus should be on the trend, which tells a more important story.
6. How does Art Revo approach directional reporting for clients ?
Art Revo uses advanced techniques like directional reporting to help clients in the UAE make data-driven decisions. By focusing on trends rather than exact figures, Art Revo provides actionable insights that guide marketing strategies, ensuring clients achieve sustainable growth in their digital marketing efforts.
7. Can Art Revo help implement GA4 for better data insights?
Absolutely! Art Revo specializes in implementing and optimizing GA4 for businesses across the UAE. Their team ensures that GA4 is set up to track key performance metrics effectively, offering personalized guidance on directional reporting to maximize the value of your traffic data.


